Freezing indexes for historic and future period
The temperature is rising and precipitation increasing, this is seen in historic observations and is evident in scenarios for the future both global and nationally in Norway. To make a robust society is an adaptation of the built environment for the expected future climate necessary.
Different climate indices has been studied within Klima 2050, such as snow loads, wet snow and risk of wood decay. In a new case study freezing indexes are studied for historic and future period. Knowledge of the freezing index are important for buildings and infrastructure in cold climates, such as Norway, to ensure stable foundation and sufficient insulation of the constructions.
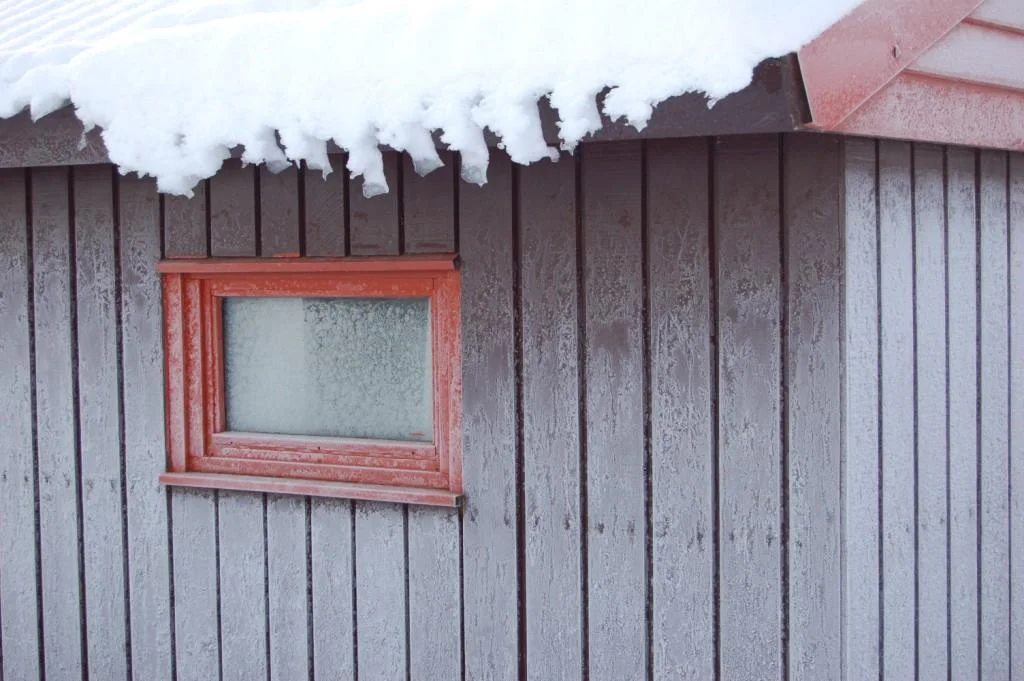
Periods with temperature around -20 °C is a normal situation of today for the Trondheim surrounding. The exposure require proper thermal insulation of the building foundation to avoid frost heave. Photo: Tore Kvande
Grids with 1*1 km² resolution are used to calculate the freezing indexes throughout our elongated country. The freezing indexes are focused on in thermal design of foundations to avoid frost heave of buildings where data for a 50 year return period is required. The present standard is based on the period 1971-2000 and are used in this study to represent the climate of today. For future scenarios the periods 2031-2060 and 2071-2100 are studied to look at the development to the mid and end of the century. Projections based on scenarios RCP4.5 and RCP8.5 were used. In this study, a set of nine regional climate model (RCM) from Euro-CORDEX is downscaled to 1*1 km² resolution for Norway to study the effects in Norway. The freezing indexes are studied as a development in time and in map to see the regional differences throughout the country both in time and space. There is no surprise that the maps show large regional variations, and that all regions show a decrease throughout the century. See figures below.
Freezing indexes map of Norway. Images made by Helga Therese Tilley Tajet, The Norwegian Meteorological Institute
Freezing index development in time for Oslo based on historic data and future scenarios. Image made by Helga Therese Tilley Tajet, The Norwegian Meteorological Institute


